Core Web Vitals
Check Your Website Core Web Vitals History: A Step-by-Step Guide
Before diving into the steps to check the historical core web vital checking process, I will briefly discuss core web vitals first.
Core Web Vitals are essential to observe and understand any website or web page performance over time.
How to measure website performance?
Website performance is generally measured in 2 ways:
- Lab Data (aka Synthetic Monitoring)
- Field Data (aka Real User Monitoring, Core Web Vitals, and CrUX)
What is the difference between Lab Data and Field Data?
Let's try to understand the difference between Lab Data and Field Data with an example.
Consider that you are a car manufacturing company owner and planning to build a top-notch vehicle for your buyers. What would be your steps? Think about it for a while :)
As a car manufacturing company, below are the steps that will be needed:
- You will design the blueprint of the car
- You will identify your target consumers
- Then manufacturing will start inside a factory (Let me call it Lab)
- The manufacturing unit will have pre-set conditions to manufacture the vehicle for the buyers
- You pass all tests for specific target customers and launch the car
You have to take this approach because you are still manufacturing the car and do not have real-world user feedback, so you go for a top-notch synthetic process to meet the real-user expectation before launch.
Now replace the car with your website. To develop a website initially, you need to know your user personas which I call VPF (Visitor First Persona), and you define your user segment. Let's say I am going to develop this website for everyone, but my primary target would be to render my website ideally in, let's say, the below categories:
- Macbook users with Wi-fi networks living in the USA
- Iphone 13 users with 4G network residing in the USA
Now that you have defined your Lab Conditions, you will test your website on the mentioned VPFs (Visitor First Personas) and prepare for the launch.
Once you have launched your website, you start realizing that your website has begun attracting other personas as well, for example:
- Macbook users with Wi-fi networks living in India
- Iphone 13 users with 5G network residing in India
- Samsung S20 users with 4G fast network living in India
Now the real-world experience of these visitors will vary because you need to optimize your website performance for them. To do this, you must go back to your synthetic monitoring strategy, define new personas, and repeat the whole process.
This real-world feedback-collection process is called Field Data (aka Core Web Vitals, Real User Monitoring).
How to monitor Core Web Vitals?
Ideally, there are 2 ways to look into the Core Web Vitals, and they are:
- Look into the data provided by CrUX (Chrome User Experience) because CrUX is the only source of Free CWV data, as Google maintains CrUX data sets.
- Setup your own RUM (Real User Monitoring) or Auditzy RUM for monitoring Core Web Vitals in real-time.
What are the critical components of the core web vitals?
As of April 2023, CWVs gets calculated as per the below-mentioned metrics:
- LCP (Largest Contentful Paint)
- CLS (Cumulative Layout Shift)
- INP (Interaction To Next Paint)
Largest Contentful Paint (LCP):
Largest Contentful Paint marks the time at which the largest text or image is painted (rendered) on the browser for any web page. Generally, it's the largest Image, Videos, Texts etc.
CLS (Cumulative Layout Shift):
Cumulative Layout Shift measures the movement of visible elements within the viewport. It calculates the overall visual stability of the web page.
Interaction To Next paint (INP):
INP metric designed to measure the responsiveness of a website. INP evaluates how quickly a web page responds to user interactions, such as clicks, taps, or key presses, and reflects the time from user interaction to the next paint of the page.
How are core web vitals calculated?
CWVs are calculated over a frequency of 28 days by the Chrome Browser if the user using Chrome has opted-in to provide this data.
We all know that Chrome is a widely used browser, and hence this free Core Web Vitals data generation approach makes sense because you will learn free of cost how your website is behaving across users on Chrome Browser at least.
All the metrics mentioned above (LCP, CLS and INP) will be marked as pass once they satisfy the 75th percentile of the website visitors as per the guidelines set by Google.
Below Images will help you understand the numeric values for the p75 threshold for LCP, INP, and CLS for one of the websites. You can see 3 stages, Good, Needs Improvement, and Poor.
Sometimes you might not find any CWV data for a URL; it may be because your webpage may not be experiencing more traffic or it's new. In this scenario relying on Lab Data or using Auditzy RUM is the way forward.
How to check Historical Core web vitals?
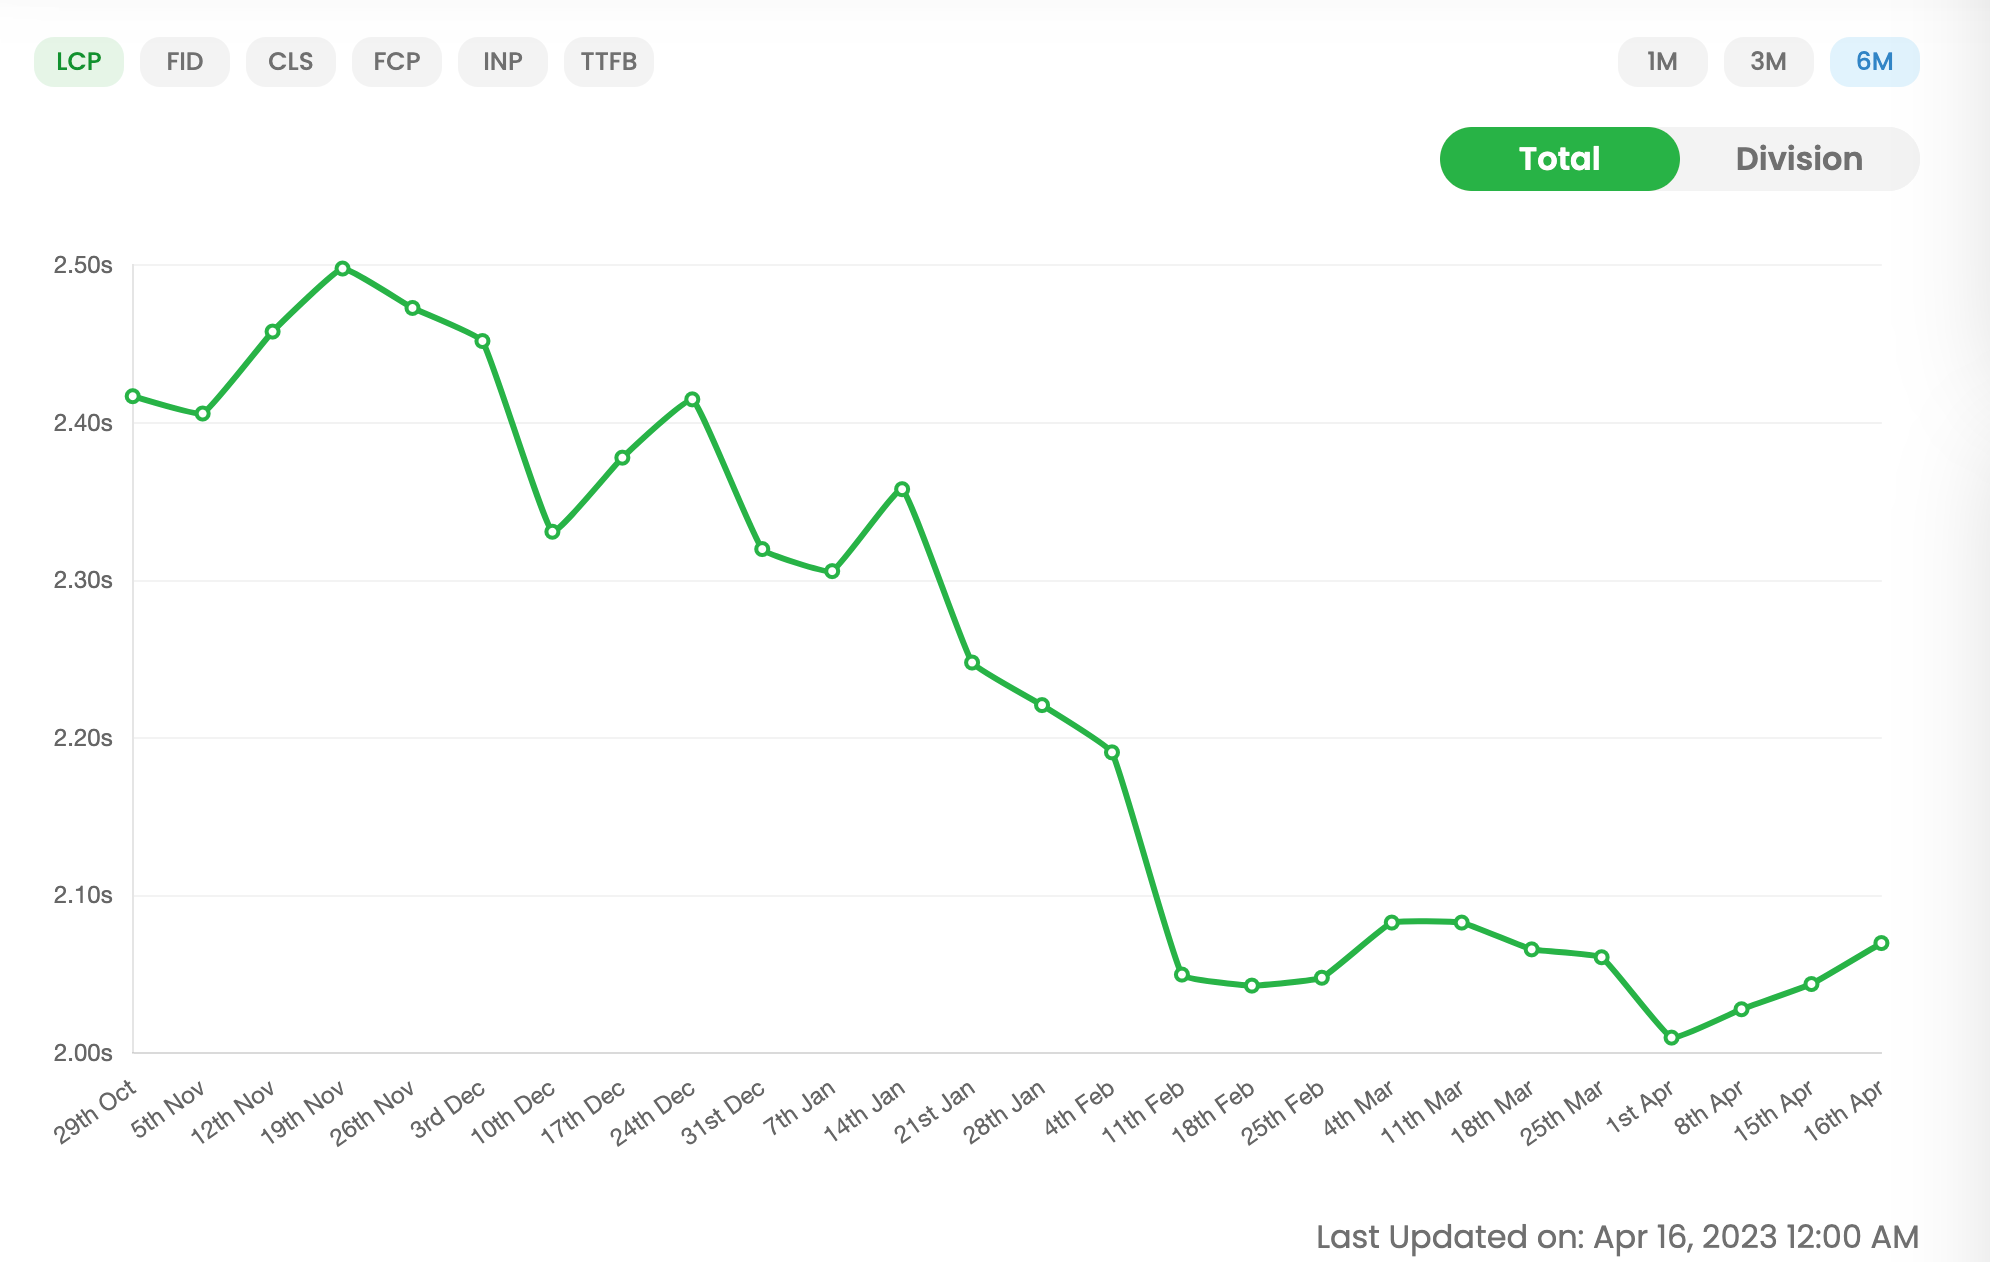
As of April 2023, Page Speed Insights will only provide you with the CWV data for the last 28 days.
But we at Auditzy now provide you with the last 6-month Core Web Vitals data for any website URL for both Domain and Exact URL levels. The data source is CrUX only, which is also the data set for PSI and CWVs.

Benefits of Passing Core web vitals?
- Better SERPs (Search Engine Ranking Positions)
- Higher Conversion Rates
- Higher CTRs (Click Through Rates)
- Longer Session Time
- Reduced Bounce Rates
- Happy and Satisfied Website Visitors (most important)
You can learn more about the business impact of core web vitals here
Conclusion
Website performance monitoring & optimisation is a critical process for website-first businesses; over time, more and more traffic will come to the website, and the website needs to be faster when the traffic hits because no one wants to visit a website with a higher loading time.
Hence, setting up Synthetic and CWV monitoring is very important to understand user behaviour regarding the data.
If you like this article, share it across your network, and stay ahead in the website speed game.
Get started with Auditzy for real-time core web vitals monitoring.


